The complete guide to cryptocurrency trading for beginners
What is Trading?
Trading stands as a fundamental concept within the realm of economics. It involves the process of exchanging assets through the acts of purchase and sale. These assets can manifest as tangible goods or intangible services. In these transactions, the buyer compensates the seller in return for the inherent value of the asset. In other scenarios, trading might involve the barter system, where commodities and services are exchanged directly between parties involved in the transaction.
Within the intricate domain of financial markets, these traded assets are often termed as financial instruments. This category encompasses a broad spectrum of assets, such as stocks, bonds, currency pairs in the dynamic Forex market, options, futures contracts, margin products, cryptocurrencies, and a multitude of other complex financial tools. If some of these terms appear unfamiliar, don't fret, as we will offer comprehensive explanations as we delve deeper.
The concept of "trading" mainly pertains to short-term trading endeavors, where traders actively participate in swiftly opening and closing positions within relatively brief timeframes. Nevertheless, it's essential to understand that trading encompasses a diverse array of strategies, including day trading, swing trading, trend following, and various other approaches. As we proceed, we will explore these trading strategies in more detail, providing you with a thorough comprehension of this multifaceted discipline.
What Is Investment?
Investment encompasses the process of deploying resources, such as capital, with the goal of generating financial gains. This can involve utilizing funds to establish and support a business or acquiring real estate with the intention of selling it at a higher value down the line. In the realm of financial markets, investment typically involves allocating money into financial instruments with the anticipation of selling them at a future date for a profit.
A pivotal concept in investment is the Return on Investment (ROI). Unlike trading, which often focuses on short-term gains, investment revolves around the idea of long-term capital appreciation. Investors aim to amass wealth over extended time frames, which can span years or even decades. There are diverse approaches to achieve this objective, but the journey to identify potential investment opportunities usually begins with a comprehensive fundamental analysis.
The enduring nature of investment strategies grants investors the advantage of not fixating on short-lived price fluctuations. Instead, they frequently embrace a passive stance and give little regard to momentary setbacks or losses.
What Sets Trading Apart from Investing?
Both traders and investors aim to generate profits in financial markets, but they employ different approaches to achieve this goal.
Typically, investors have a long-term perspective, often spanning many years or even decades, in their quest for profitability. Since investors adopt a long-term outlook, their expectations regarding the returns from each investment are also higher.
On the other hand, traders seek to capitalize on price fluctuations in the market. They frequently open and close positions, expecting smaller profits from each trade (as they often engage in numerous trades).
Which strategy is better? Which one suits you best? The decision ultimately rests with you. You can begin by studying the markets and then determine which strategy aligns most effectively with your financial objectives, personal preferences, and trading style.
What Is Fundamental Analysis (FA)?
Fundamental analysis is a method for evaluating the value of a financial asset in which an analyst examines economic and financial factors to determine whether the current asset price is fair. Fundamental analysis takes into account macroeconomic conditions, the state of a specific industry, and business aspects related to the asset in question (if applicable). Typically, these factors are tracked using leading and lagging indicators of macroeconomics.
Through fundamental analysis, an analyst seeks to determine whether an asset is undervalued or overvalued. Investors can use the results of this analysis to make investment decisions.
In the case of cryptocurrencies, fundamental analysis can also be based on Data Science, which analyzes publicly available blockchain data, known as on-chain metrics. These metrics include network hash rate, holder activity, the number of active addresses, and transaction analysis. By utilizing a variety of this data, analysts create complex technical indicators that measure various aspects of overall network activity.
Although fundamental analysis is widely used in stock markets and the foreign exchange market (Forex), its application in the cryptocurrency market is limited. This asset class is relatively new and lacks standardized valuation methods. Additionally, the cryptocurrency market is heavily influenced by speculation and media narratives, so fundamental factors have limited impact on price dynamics. However, as the cryptocurrency market develops, more precise methods for valuing cryptocurrencies may emerge.
What Is Technical Analysis (TA)?
Technical analysis entails the scrutiny of past price movements within the market to discern potential future trends.
Technical analysts refrain from determining the intrinsic value of an asset; instead, they delve into historical trading activities, seeking indicators that can serve as guiding principles for trading decisions. This method encompasses an array of metrics, including price charts, trading volumes, graphical patterns, and the application of technical indicators. The primary goal is to assess the market's strength or weakness.
Moreover, technical analysis serves as a valuable risk management tool. By furnishing analysts with a structured approach to analyzing market dynamics, it transforms risk management into a more tangible and quantifiable process. This empowers traders to make well-informed decisions regarding their trades. Consequently, some technical analysts may exclusively employ this methodology for the sake of risk management.
Technical analysis is adaptable and can be applied across a wide spectrum of financial markets. It is particularly prevalent among cryptocurrency traders who operate in an environment heavily influenced by speculation and characterized by frequent price fluctuations. In such conditions, technical analysis emerges as an indispensable instrument for analysis and decision-making.
Fundamental analysis and technical analysis - what to choose?
It entirely depends on your market strategy. Why not use both methods? Most often, the best results are achieved when different analytical methods are combined with each other and various indicators. This increases the likelihood of identifying more reliable investment opportunities. Using different trading strategies can also help reduce subjectivity in the decision-making process.
This approach is sometimes called a merger. Traders who apply a merger combine several strategies to leverage their strengths. The idea is that combined strategies can provide more powerful trading opportunities compared to single strategies.
What factors affect financial markets?
The price of an asset is essentially determined by the interplay between supply and demand. In simpler terms, it's the buyers and sellers who establish the price. When demand aligns with supply, a market comes into existence. But what else can have an impact on altering the value of a financial asset?
We've previously discussed that various factors come into play, including fundamental elements like the economic situation, technical factors such as cryptocurrency market capitalization, and other aspects that are worth taking into account, like market sentiment or the latest news.
However, it's important to recognize that all these elements are essentially "variables." In practice, the price of an asset at any given moment is shaped by the equilibrium between supply and demand.
What is a Market Trend?
A market trend denotes the general direction in which prices are headed within a specific market. In technical analysis, market trends are ascertained by scrutinizing price charts, trend lines, and employing various analytical tools.
Broadly, there are two primary types of market trends: bullish and bearish. A bullish market exhibits a sustained upward trajectory, with prices consistently on the rise. Conversely, a bearish market involves an enduring downward trend, characterized by continuous price declines. Moreover, there are periods of sideways trends when the market experiences consolidation, lacking a distinct upward or downward movement.
It's crucial to comprehend that a market trend does not imply a unidirectional price movement. Temporary bearish trends can manifest within longer-term bullish markets, and vice versa. Such fluctuations are inherent to market dynamics. The identification of a trend depends on the specific timeframe under examination, with longer-term trends carrying more significance than shorter-term ones.
An essential point to bear in mind about market trends is that they can only be confidently acknowledged in hindsight. The concept of hindsight bias underscores that individuals often mistakenly believe they predicted events beforehand when, in reality, they did not. Consequently, recognizing market trends and making informed trading decisions necessitate comprehensive analysis and an impartial assessment of available information.
What is a Market Cycle?
You may have heard the expression, "the market is subject to cyclicality." A market cycle refers to a pattern or sequence of changes that occur in financial markets over different periods of time. Typically, the most reliable market cycles are observed on long-term timeframes, but even shorter timeframes can exhibit smaller market cycles.
The nature of market cycles implies that different asset classes will take the lead at different stages of the cycle. For example, during one stage of the cycle, stocks may be profitable, while in another stage, they may lag behind other assets due to changing market conditions.
It's essential to note that at any given moment, it's challenging to confidently determine which stage of the market cycle the markets are in. Cycle analysis is often performed with greater precision only after a specific stage has concluded. Furthermore, market cycles rarely have distinct beginnings and endings, and the "here and now" perspective on financial markets can be subjective.
If you wish to delve deeper into the study of market cycles, it is recommended to explore our article on the "Psychology of Market Cycles."
Financial markets and trading instruments
What Is a Financial Instrument?
In simple terms, a financial instrument is an asset that can be bought or sold in the market. This can include cash, precious metals, stocks, bonds, derivatives, and much more. Financial instruments can be diverse and complex, but at their core, they are the basis for trading.
There are several ways to classify financial instruments. One of them is based on whether the instrument is a primary or derivative one. Derivative instruments depend on the value of other assets (e.g., options or futures). Instruments can also be debt-based (credit products) or equity-based (stocks, ownership shares in a company).
Regarding cryptocurrencies, they can be viewed from different perspectives. They can be seen as digital assets as they represent a digital store of value. However, they also have the potential to disrupt existing financial systems and create a new ecosystem. With the advancement of cryptocurrency technology, they may also give rise to new categories of assets, such as decentralized finance (DeFi) and others.
What Is the Spot Market?
The spot market is a platform where financial instruments are instantly traded for cash or other assets. It is characterized by swift transaction execution and immediate settlement. This sets it apart from the futures market, where assets are delivered at a predetermined future date, such as upon the expiration of a futures contract.
In more straightforward language, the spot market is where transactions happen "right away" without any waiting periods. The market price of an asset on the spot market is known as the spot price. This distinction between the spot market and futures or derivatives markets is significant because it affects how assets are bought and sold and when ownership changes hands.
What Is Margin Trading?
Margin trading is a trading method in which traders use borrowed funds from a third party. It allows for the potential amplification of both profits and losses. With a margin account, traders can control larger positions using a smaller amount of their own capital on the exchange.
Key concepts in margin trading include "margin" and "leverage." Margin refers to the trader's own capital deposited into the account. Leverage determines how much a trader can increase their position size relative to their margin. For example, 2x leverage allows for a position twice the size of the margin, and so on.
However, it's crucial to be aware of the risks associated with margin trading. Using high leverage can lead to rapid and substantial losses if market conditions turn against the trader. Therefore, traders should exercise caution and assess their risks before engaging in margin trading.
What Is the Derivatives Market?
The derivatives market is a sector within financial markets where financial instruments are traded, and their worth relies on another asset called the underlying asset. This underlying asset can vary and may encompass stocks, bonds, commodities, market indices, or cryptocurrencies.
Derivatives themselves are agreements between different parties, and their value derives from the underlying asset. It's important to grasp that a derivative instrument lacks its own inherent value but instead derives its value from fluctuations in the price of the underlying asset. Instances of derivatives encompass futures contracts, options, and swaps.
The derivatives market is regarded as one of the largest and most intricate segments of financial markets. It offers tools for managing risk and engaging in speculative trading based on changes in the value of underlying assets. Nevertheless, due to its intricacy and potential risks, the derivatives market can also be associated with financial crises and market volatility.
What Are Forward and Futures Contracts?
Futures contracts represent formal agreements between two parties that outline a future transaction involving a specific asset at a predetermined price and date, known as the contract's expiry date. These assets can encompass a wide range of financial instruments, including cryptocurrencies, commodities, stocks, or bonds.
The expiry date plays a crucial role in futures contracts, marking the point when the contract concludes. At this juncture, the involved parties face two options: they can either fulfill the contract by physically transferring the asset (such as delivering a specific quantity of oil) or choose a cash settlement, which involves settling the contract financially based on the difference between the agreed-upon contract price and the current market value of the asset.
In essence, futures contracts provide traders and investors with a valuable tool for making predictions and speculating on the future price movements of an asset. Beyond speculation, these contracts are robust instruments for managing risk and protecting investment portfolios. The execution of a futures contract can occur through two primary methods: physical delivery, which involves the actual transfer of the asset, or cash settlement, which offers a financial resolution without the physical exchange of the underlying asset.
What Are Perpetual Futures Contracts?
Perpetual futures contracts are trading tools that provide traders with the opportunity to speculate on an asset's price without a specified expiration date. In contrast to regular futures contracts, which come with a definite end date, perpetual futures do not have such limitations, making them more adaptable for extended-term trading.
Nevertheless, perpetual futures contracts come with a distinctive feature related to the price variation between the contract and the underlying asset's market price. A significant deviation in price can lead to unfavorable outcomes. To address this concern and maintain price equilibrium, perpetual futures employ a funding rate.
The funding rate fluctuates based on the degree of disparity between the contract price and the asset's market price. If the contract trades above the asset's price, a positive funding rate encourages contract buyers to make payments to sellers, facilitating convergence between the contract price and the asset's market price. In cases where the contract trades below the asset's price, a negative funding rate necessitates payments from contract sellers to buyers, also contributing to price alignment.
Consequently, perpetual futures contracts incorporate a funding mechanism to regulate contract prices, ensuring they remain closely aligned with asset prices in the market.
What Are Options?
An option contract is a fascinating facet of derivative financial instruments, endowing traders with a unique privilege—though not an obligation—to acquire or dispose of an asset at a predetermined price in the future. It's worth noting that options stand apart from their derivative counterparts, such as futures, in the sense that they offer flexibility without the necessity for contract execution.
When investors step into the realm of option contracts, they embark on a journey of speculation, making calculated bets on the potential price movements of underlying assets. The world of options is typically divided into two main categories: call options, granting traders the power to bet on an asset's price ascent, and put options, conferring the right to sell an asset at a predefined price—an advantageous maneuver when anticipating a price downturn.
The fascinating aspect of option contracts is their versatility; they can be linked to a diverse range of financial assets. This includes market indices, commodities, stocks, cryptocurrencies, and a multitude of others. The complexity of these contracts often invites the exploration of intricate trading strategies and the implementation of ingenious risk management techniques, such as hedging. Within the domain of cryptocurrencies, options assume particular significance, offering miners a valuable tool to shield their crypto holdings from the roller-coaster ride of price volatility.
What Is the Forex Market?
The Forex market (Forex or FX) is a global marketplace where traders can exchange one country's currency for another. This market plays a vital role in determining exchange rates worldwide.
Currencies are often viewed as stable assets, but in reality, their values are subject to significant fluctuations. These fluctuations are driven by supply and demand dynamics and influenced by various factors, such as inflation, global economic events, and geopolitical forces.
Participants in the Forex market include investment banks, central banks, commercial corporations, investment funds, hedge funds, and retail traders. This market also serves as a platform for conducting international trade transactions and currency conversion for global settlements.
To maximize profits in the Forex market, traders often employ various strategies, including day trading and tactics based on leverage. The Forex market is a pivotal component of the modern global economy and is considered the largest and most liquid financial market in the world.
Trading and investment strategies
What Is a Trading Strategy?
A trading strategy encompasses a pre-defined set of actions that articulate your approach to trading. Since there is no one-size-fits-all strategy, each strategy is distinct and personalized according to your individual goals and preferences.
Regardless of the trading technique you select, developing a trading plan holds significant importance. It assists in establishing clear objectives and enforces discipline to prevent impulsive decision-making. When charting out your trading course, you need to make decisions on the types of assets you plan to trade, the methods by which you'll execute trades, and the specific entry and exit points you'll utilize.
In this section, we will explore various commonly employed trading strategies.
What Is Portfolio Management?
Portfolio management is the process of creating and overseeing a collection of investments. A portfolio can encompass various assets, from digital coins to real estate and various forms of investments.
The first step in portfolio management is to define your investment goals and expectations. You must decide whether you want to have a stable and volatility-protected portfolio or are willing to take risks for the potential of higher returns.
It's also crucial to determine your portfolio management style. Some prefer a passive approach, where they allocate their investments and refrain from frequent interference over an extended period. Others prefer active management, which involves frequent buying and selling of assets to maximize profits.
What Is Risk Management?
Effective management of risk is essential in the realm of trading and commences with recognizing different risk types you may confront.
The primary category is market risk, which relates to potential losses due to fluctuations in asset values.
The second category is liquidity risk, which is more prevalent in illiquid markets and involves challenges in finding buyers for your assets.
Operational risk, the third category, encompasses potential losses arising from operational issues such as human errors, equipment malfunctions, software glitches, and even employee fraud.
Lastly, systemic risk, the fourth category, arises when the failures of one company or sector can have widespread consequences throughout the entire industry. For instance, the Lehman Brothers' collapse in 2008 triggered a global financial crisis.
To identify these risks, you should meticulously assess the assets within your portfolio, considering both internal and external factors. Subsequently, evaluate the frequency and severity of these risks. Based on this assessment, you can formulate strategies and measures to mitigate risks, including diversifying your investments across various assets and implementing stop-loss orders.
What Is Day Trading?
Day trading, also referred to as intraday trading, is a trading approach where a trader opens and closes positions in the market within a single day's trading session. This terminology originated in traditional financial markets where trading occurs during specific working hours, and positions must be closed before the session concludes.
In the context of cryptocurrency markets, which operate continuously 24/7, day trading involves actively trading with the objective of initiating and concluding positions within a 24-hour timeframe.
For making decisions regarding the selection of assets suitable for day trading, traders frequently rely on technical analysis. This trading style aims to maximize potential profits over a brief timeframe and often involves numerous trades executed throughout the trading day.
Day trading represents a highly active trading strategy that can yield profits but is also linked to significant risks. As a result, it typically demands a profound understanding of market dynamics, effective risk management, and a disciplined approach to trading.
Swing Trading Explained
Swing trading is an approach to trading where traders aim to capitalize on fluctuations in asset prices, but they do so over a more extended time horizon compared to day trading. Typically, swing traders maintain their positions for periods ranging from several days to several weeks, and occasionally even a few months.
The primary objective of swing trading is to identify assets that traders believe are either undervalued and likely to experience price increases or overvalued and poised for price declines. Traders can choose to purchase undervalued assets and sell them when their prices appreciate, or they can sell overvalued assets and later repurchase them at lower prices.
Swing traders heavily rely on technical analysis, frequently complemented by considerations of fundamental factors, to identify favorable entry and exit points. Technical analysis helps pinpoint specific levels for entering and exiting positions based on price patterns and indicators, while fundamental analysis offers insights into the underlying financial health and future prospects of the assets.
This trading strategy strikes a balance between day trading and long-term investing. Swing traders are not required to constantly monitor the market but should remain attentive enough to take advantage of short- to medium-term price fluctuations. As a result, it is a versatile and accessible strategy suitable for traders of different experience levels.
What Is Position Trading?
Position trading, also referred to as trend trading, is a strategy that revolves around long-term investment. In this approach, traders acquire assets and retain them in their portfolios for extended durations, often spanning several months or even longer. The primary objective of position trading is to generate profits by selling these assets in the future at higher prices.
Position traders direct their attention towards long-term market trends and endeavor to identify overarching price directions. Unlike swing traders, who concern themselves with short-term market fluctuations, position traders analyze extensive market processes. Consequently, fundamental analysis assumes greater significance for them as they seek to identify factors that may exert an influence on future prices.
Position traders do incorporate technical analysis into their strategies, but their focus is on maintaining the prevailing overall trend rather than reacting to short-term market gyrations. Their approach is typically characterized by lower activity and a more laid-back demeanor compared to other trading styles. This characteristic can make position trading an attractive option for novice traders, allowing them more time for thoughtful decision-making.
What Is Scalping?
Scalping is a trading strategy focused on the shortest time frames. Scalpers aim to capture small price changes, often entering and exiting positions within minutes, and sometimes even seconds. These traders typically rely on technical analysis to predict price movements, monitor bid-ask spreads, and pay close attention to minute details to extract profits. Due to the short-term nature of this strategy, scalpers typically generate small percentage profits, often less than 1%. However, scalping is based on a high volume of trades, so multiple small profits can accumulate over time.
Scalping is a highly effective but complex strategy and is usually not recommended for beginners. This style requires a deep understanding of the market, the trading platform used, as well as technical analysis. However, for experienced traders who have mastered this strategy, the ability to identify the right patterns and react quickly to short-term price changes can lead to significant profits.
Diversification and Asset Allocation Explained
Diversification and asset allocation are strategies aimed at reducing investment risk by spreading funds across different assets or asset classes. The principle of "don't put all your eggs in one basket" suggests that investing all your funds in a single asset or asset class can pose significant risk. If the chosen asset or market sector encounters difficulties or declines, it can lead to substantial losses.
Diversification goes beyond just investing in a variety of different cryptocurrencies. It's also essential to consider the correlation between assets. For example, if different cryptocurrencies have similar dependencies on common factors, they may move in the same direction, making your portfolio vulnerable to specific risks.
The essence of Modern Portfolio Theory (MPT), proposed by Nobel laureate Harry Markowitz, is to allocate investments across different asset classes that do not strongly correlate with each other. This helps reduce portfolio volatility and risk while maintaining the potential for returns.
In summary, diversification and asset allocation contribute to creating a more resilient and balanced investment portfolio.
What is Dow Theory?
The Dow Theory is based on financial principles formulated by Charles Dow, who is considered one of the founders of the modern financial market. Although Dow never presented this theory in a formal or systematic form, his ideas and principles were formulated based on his work and experience.
The key principles of the Dow Theory include:
-
All information is reflected in asset prices. Dow supported the Efficient Market Hypothesis, which posits that asset prices reflect all available information about them.
-
Market trends exist. Dow recognized the presence of market trends and distinguished between primary, secondary, and tertiary trends.
-
Three phases of the primary trend. He identified three phases of the primary trend: the accumulation phase, the participation phase, and the distribution and revaluation phase.
-
Cross-index correlation. Dow believed that a trend in one index cannot be confirmed if it is not present in another index.
-
The importance of volume. He emphasized that trends are confirmed by high trading volume.
-
Trends are assumed to continue until clear reversal signals appear. If a trend is confirmed, it is assumed to persist until there is a distinct change in direction.
The Dow Theory, despite its informal nature, remains an important part of financial methodology for many traders and investors.
What is Elliott wave theory?
The Elliott Wave Theory (EWT) is a principle that asserts that movements in financial markets reflect the psychology and sentiment of market participants. EWT is not a specific trading strategy but rather a method for analyzing market structure.
According to this theory, market movements can be represented as a series of waves, typically eight, each of which is either impulsive (corresponding to the overall trend) or corrective (moving in the opposite direction). Five of these waves are impulsive, and three are corrective.
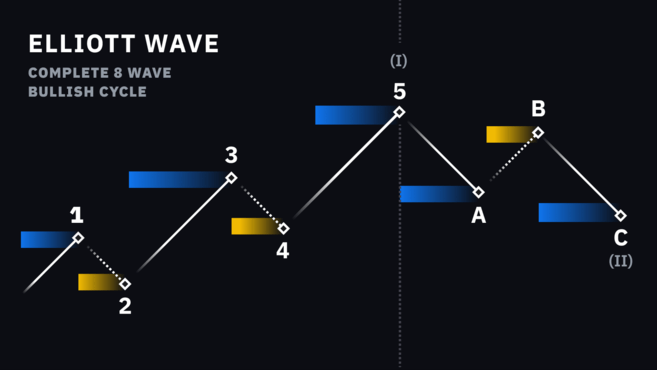 Elliott wave cycle with impulse waves (blue) and corrective waves (yellow).
A significant feature of Elliott Wave Theory is its fractal structure, which means that you can zoom in or out in terms of analysis and find similar wave patterns on different timeframes.
Despite having its proponents, Elliott Wave Theory also faces skepticism due to its subjective nature. Different traders may identify waves differently, making this method less reliable. Nevertheless, many traders successfully use EWT in conjunction with other technical analysis tools.
What is the Wyckoff method?
The Wyckoff Method, developed by Charles Wyckoff during the 1930s, is a distinctive and enduring approach to trading and investing. It has left a significant mark on the field of technical analysis within financial markets and is highly respected for its unique principles and attributes.
Charles Wyckoff laid down three fundamental principles: the law of supply and demand, the law of cause and effect, and the law of effort versus result. His concept of the "composite man" closely aligns with Charles Dow's primary trend phases, setting this method apart.
In practical terms, the Wyckoff Method offers traders and investors a structured five-step approach:
- Identifying the current market trend.
- Assessing the strength of price movements in the asset.
- Identifying assets with growth potential.
- Evaluating the probability of future price increases.
- Systematically determining optimal entry points for establishing positions.
Despite its age, the Wyckoff Method remains pertinent and stands out in the present trading and investment landscape. It imparts valuable insights that distinguish it from other technical analysis methodologies. This succinct overview only scratches the surface of Wyckoff's substantial contributions. For a deeper grasp of his work and its unique characteristics, further exploration is recommended.
What is a buy and hold strategy?
The "buy and hold" strategy involves long-term asset ownership, which means acquiring assets and retaining them in a portfolio regardless of market fluctuations. It is a passive strategy in which investors purchase assets and do not engage in active trading. In the context of cryptocurrencies, many investors use this approach by holding onto their digital assets for extended periods.
This strategy has its advantages, such as not needing to monitor short-term fluctuations and not requiring active participation. However, it also demands a high degree of patience, as investors must believe that the asset will appreciate in value over time and not depreciate.
If you are interested in a straightforward way to apply this strategy to Bitcoin, you can explore the concept of "dollar-cost averaging (DCA)."
What is investing?
Investing in an index fund can be seen as a variation of the "buy and hold" strategy. In this case, investors aim to profit from the movement of assets that make up a specific index. This is achieved by either purchasing the assets themselves or investing in index funds.
Once again, it's important to note that this is a passive strategy. Individuals can also benefit from diversification by investing their funds in a variety of assets, thereby avoiding the need for active trading and the associated stress.
What is demonstration trading?
Demo trading, also known as paper trading, is the process in which a trader simulates making trades without actually investing real money. It's a useful tool for both beginners and experienced traders to test their strategies and skills without the risk of losing capital.
For example, let's say you've developed a strategy to predict Bitcoin price drops and want to test its effectiveness without risking real funds. Before investing real money, you can engage in paper trading by recording prices at the opening and closing of positions. There are also specialized simulators that mimic real trading platforms.
The primary advantage of demo trading is that it allows you to test your strategies without the risk of losing capital. It enables you to emulate real trading scenarios with minimal financial risk. However, it's essential to remember that paper trading doesn't fully replicate a real trading environment. Emotions and reactions to losses or gains may be different in real conditions. Additionally, demo trading typically doesn't account for commissions and other expenses associated with real trading.
Basics of Technical Analysis
What is a long position?
A long position, also known as a "long," represents a strategy in which a trader acquires an asset with the hope that its value will increase. This term is widely used in the context of derivatives, the Forex market, and other financial instruments, but it can also apply to purchasing underlying assets in the real asset market.
Opening a long position is the most common way of investing and is often used by beginners. The fundamental idea is based on the assumption that the asset's value will rise over time. For example, long-term strategies like "buy and hold" rely on the long-term growth of an asset. In this context, employing a "buy and hold" strategy is essentially equivalent to having a long position for an extended period.
It's important to note that having a long position doesn't always mean that a trader expects to profit from an increase in the asset's price. For instance, in the case of assets with an inverse relationship, such as BTCDOWN, whose price moves in the opposite direction of Bitcoin's changes, opening a long position in BTCDOWN is, in fact, equivalent to having a position where the trader expects a decrease in Bitcoin's price.
What is shortening?
Shorting, or taking a short position, involves selling an asset with the intention to buy it back at a lower price later. This strategy can be used both in spot markets and in the context of margin trading and derivatives.
In spot markets, an example would be when you own Bitcoin but believe that its price will fall. In such a case, you sell your Bitcoin for dollars, hoping to buy it back at a lower price in the future. This way, you enter into a short position on Bitcoin.
In the context of margin trading, you can borrow an asset such as stocks or cryptocurrency, anticipating that its value will decrease. After borrowing the asset, you immediately sell it. If the price of the asset does indeed decrease, you can repurchase it at a lower price, repay the borrowed funds (including interest), and keep the difference as profit.
For example, if you borrowed 1 BTC and sold it for $10,000, and then the price dropped to $8,000, you could buy 1 BTC back at the lower price and return it, repaying the debt with interest. The difference between selling at the higher price and buying at the lower price would be your profit, minus interest and fees.
What is an order book?
An order book, also known as an order book or market depth, is a list of current open orders to buy and sell a particular asset, organized by price. When a trader places an order that isn't immediately executed, that order is added to the order book and remains there until it's either matched with another order or canceled.
The structure of an order book may vary slightly on different trading platforms, but in general, it contains information about the quantity of orders at different price levels.
In the context of cryptocurrency exchanges and online trading, orders from the order book are matched and executed using a matching engine, which determines which orders should be executed based on current market conditions. You can think of the order book and matching engine as the intelligent system of the exchange that determines which orders should be filled based on the prevailing market conditions. The order book and matching engine play a crucial role in electronic trading, providing transparency and market efficiency.
What is order book depth?
The depth of the order book, also known as the market depth, represents a visualization of the current open orders in the order book. The graph displays the total volume of buy and sell orders distributed across different price levels.
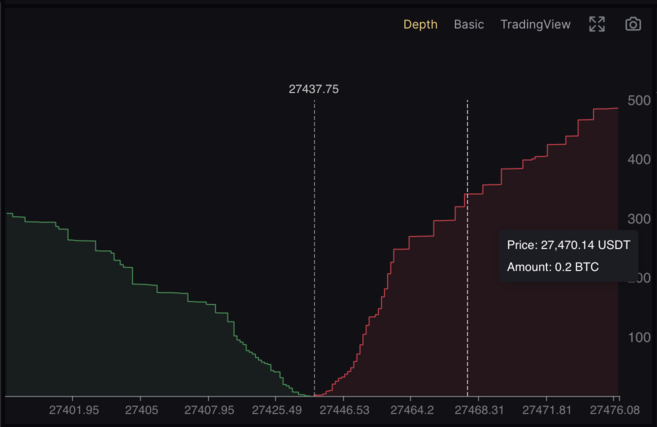 Depth of the order book of the BTC/USDT market pair
In a broader sense, the depth of the order book reflects the available liquidity in the market. The "deeper" the market, the more liquidity is available in the order book. On more liquid markets, it is possible to execute large trades without significantly impacting the current price of the asset. Whereas on illiquid markets, large orders can substantially change the asset's price.
What is a market order?
A market order is a request for immediate execution of a buy or sell order at the current best available market price. Its essence is to complete the transaction instantly at the best price available at that moment.
When placing a market order, you are essentially expressing a desire to execute the operation immediately without waiting for a change in price. A market order will be executed until the entire order volume is filled. This means that large market orders can impact the price of the asset, as they can remove liquidity from the market by executing orders from the order book of other traders.
What is slippage in trading?
Slippage in trading occurs when your market order is executed at a price different from the one you anticipated. When you place a market order, you are asking the system to fill it immediately at the best available price at that particular moment. However, in situations where the market has limited liquidity or experiences rapid price fluctuations, your order may be filled at a less favorable price than you expected.
For instance, if you wish to buy a significant amount of cryptocurrency on a market with low liquidity using a market order, your order will be filled in stages at various prices because there are only a limited number of sellers available. When the execution of your order is complete, the average price may turn out to be higher than what you initially had in mind. This phenomenon is referred to as slippage, which represents the disparity between your expected price and the actual execution price of your order due to constrained market liquidity.
It's crucial to consider the possibility of slippage when engaging in trading, especially on markets with low liquidity, in order to prevent unforeseen expenses or losses.
What is a limit order?
A limit order is an instruction to buy or sell an asset at a specific price or a better one. The specified price at which you intend to execute the transaction is known as the limit price. Buy limit orders will only be executed at the limit price or a lower one, while sell limit orders will only be executed at the limit price or a higher one.
In essence, a limit order ensures that your trade will take place at the price you've set or a more favorable one if available. However, there's a possibility that the market may not reach your chosen price, resulting in your order remaining unexecuted.
The decision of whether to use a limit order or a market order depends on your preferences and trading strategy. Some traders exclusively use one type, while others employ both order types based on the current market conditions. This decision is crucial and requires an understanding of and assessment of the present market situation.
What is a stop loss order?
A stop-loss order is a type of order that is triggered only when a pre-defined price, known as the stop price, is reached. Stop-loss orders are primarily used to limit potential losses in trading.
Here's how a stop-loss order works: when the market price reaches or crosses your stop price, the stop-loss order is activated and can become either a market order or a limit order, depending on your choice. This helps you automatically close your position if the market moves against you, thereby protecting your investments.
It's important to note that stop-limit orders may remain unexecuted in extreme market situations if the price sharply exceeds your specified limit price. In such cases, stop-market orders are preferable as they ensure execution at the current market price when the stop price is triggered, helping to avoid additional losses during times of market volatility.
Who are makers and takers?
Makers and takers are terms used in the context of exchange trading to classify traders based on their roles in providing or taking liquidity in the market.
Makers are traders who become makers when they place an order that is not executed instantly and is added to the order book. They "create" liquidity by offering other traders the opportunity to trade with them. Typically, limit orders are classified as maker orders, but sometimes they can be executed as taker orders depending on market conditions.
On the other hand, takers are traders who become takers when they place an order with immediate execution, which is immediately matched with orders in the order book. Takers "take" liquidity from the order book, and their orders are executed at the current market price. Market orders are always considered taker orders since they require immediate execution.
Many exchanges employ a fee structure that incentivizes traders to provide liquidity to the market. Typically, makers pay lower fees than takers because they contribute to liquidity, which is crucial for the market's viability. Such fee structures may include fee discounts for makers and higher fees for takers to encourage liquidity provision.
What is a bid-ask spread?
The bid-ask spread is the difference between the highest price at which someone is willing to buy an asset (bid) and the lowest price at which someone is willing to sell that asset (ask). This spread is an indicator of the gap between buying and selling prices for a given asset in the market.
The bid-ask spread is an important measure of market liquidity. If the difference between the buying and selling price is small, the market is considered liquid because there is little gap between the prices at which traders can buy or sell the asset. This indicates that there are enough active participants in the market willing to transact.
When using a market order to buy, it will be executed at the lowest available selling price at the time of the trade. Similarly, when placing a market order to sell, it will be executed at the highest available buying price.
What are candlestick charts?
A candlestick chart is a method of visually representing the prices of an asset over a specific time interval. It consists of candlesticks, each of which represents a fixed period of time, such as an hour or a day. Each candlestick has four key values: the opening price, the closing price, the highest price, and the lowest price, sometimes abbreviated as OHLC.
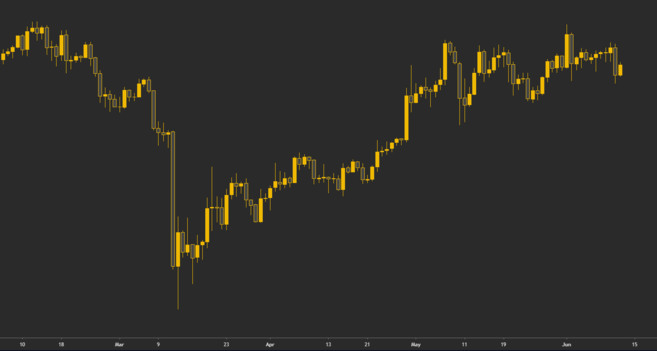 Daily chart of the situation. Each candle represents one trading day.
The opening price is the price of the asset at the beginning of the specified time period, and the closing price is the price of the asset at the end of that period. The highest and lowest prices represent the highest and lowest values reached by the asset during that period.
Candlestick charts are an important tool for financial data analysis and trading. They have ancient origins, starting with their development in Japan in the 17th century, and were further refined and perfected in the 20th century by influential traders like Charles Dow.
What is a trendline?
Trendlines are an important tool in the arsenal of traders and technical analysts. These lines connect specific data points on a chart, typically related to price dynamics. However, they can also be used for other data, including technical indicators and oscillators.
The primary purpose of trendlines is to visualize certain aspects of price movement, allowing traders to analyze the overall market trend and its structure. Some traders use trendlines for a deeper understanding of market dynamics, while others create trading strategies based on price interactions with these lines.
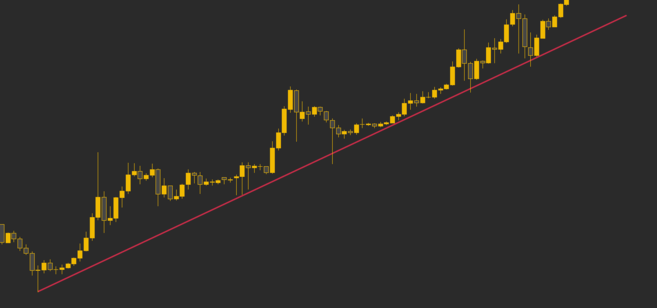 Bitcoin price touches the trend line several times, indicating an uptrend.
Trendlines can be applied to charts with different timeframes, but they are often more reliable on higher timeframes. One key aspect of using trendlines is their confirmed strength, which usually requires the trendline to be intersected by the price multiple times to be considered significant.
What are support and resistance?
Support denotes a level where the price typically finds sufficient demand to halt its downward movement. It can be likened to a "base" where the price seems to rebound upwards due to the interest of buyers.
In contrast, resistance signifies a level where the price usually encounters enough selling pressure to prevent it from advancing further. It can be visualized as a "barrier" where the price appears to meet sellers who push it in a downward direction.
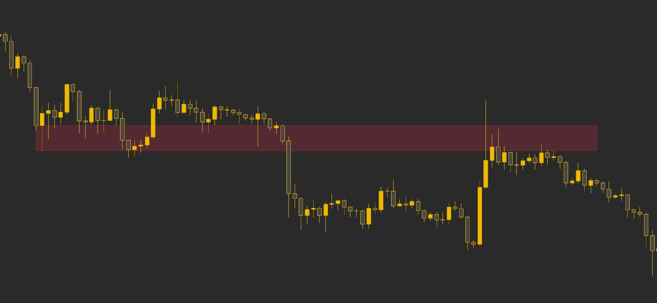 The support level (red) is tested and broken, moving into the resistance level.
Support and resistance levels can be determined through various techniques, including an examination of past price movements, the utilization of technical indicators like trendlines, moving averages, Bollinger Bands, and Fibonacci levels. They can also be influenced by market psychology, where traders and investors react to specific price thresholds.
It's important to recognize that support and resistance levels can change over time and due to diverse factors, so traders and investors consistently analyze them to guide their trading decisions.
Technical analysis indicators
What are technical indicators in technical analysis?
Technical indicators in the analysis of financial markets are tools that conduct calculations based on various parameters associated with financial instruments. These calculations can rely on factors such as price, trading volume, blockchain data, open interest, social indicators, and other variables.
Practitioners of technical analysis adhere to the notion that analyzing historical price data can aid in forecasting future price fluctuations. Consequently, traders and investors who employ technical analysis utilize a variety of technical indicators on price charts to pinpoint potential entry and exit points within the market.
Indicators can be categorized using various criteria. Nonetheless, a primary classification distinguishes them into leading indicators, which seek to anticipate forthcoming trends, lagging indicators, which confirm existing trends, and coincident indicators, which furnish real-time information.
Another classification segregates them into trend-following indicators, which illustrate the general direction of price movement, and oscillators, which fluctuate between minimal and maximal values.
Each indicator can fulfill a specific role in market analysis, and the selection of a particular indicator hinges on the trader's trading strategy. It is imperative to possess a sound understanding of the workings of each indicator and how to apply it in specific market scenarios.
Leading and lagging indicators
Leading and lagging indicators play different roles in market analysis and are used depending on specific objectives and timeframes.
Leading indicators are typically employed to forecast future events and trends. They are especially useful in short-term and medium-term analysis when traders and analysts aim to predict potential market changes. In an economic context, leading indicators can be used to early detect trends such as recessions.
In trading and technical analysis, leading indicators also assist in making decisions to buy or sell assets based on expectations of future movements. It's important to note that no indicator can accurately predict the future, and their use requires caution.
On the other hand, lagging indicators are used to confirm events and trends that have already occurred. They can indicate that a specific price movement or trend has already taken place. This can be valuable for analyzing longer-term market trends.
While lagging indicators may appear less predictive, they can uncover hidden aspects of the market and alert to potential risks. Thus, they are often used in the analysis of longer-term charts and to confirm information about the current state of the market.
What is a momentum indicator?
Momentum indicators are tools that assess and display the degree of price movement in the market, known as momentum. In this context, momentum is a measure of the speed of price level changes. These indicators are used to gauge how quickly prices are rising or falling in the market. Such indicators are typically geared towards short-term analysis and are widely used by traders looking to capitalize on periods of high volatility.
The main objective of a trader focused on momentum is to enter trades when momentum in the market is most pronounced and exit positions when this momentum begins to wane. During periods of low volatility, prices usually remain in a narrow range, but as volatility increases, prices can move sharply, breaking out of that range. It is precisely during these moments that momentum-oriented traders may find opportunities for profitable trading.
Once the move is completed, and traders close their positions, they may shift to another high-momentum asset and repeat the process. Thus, momentum indicators are widely employed by day traders, scalpers, and short-term specialists seeking opportunities for fast and profitable trading in the market.
What is trading volume?
Trading volume is a significant technical indicator that represents the number of transactions conducted with a specific asset during a specified time frame. In simpler terms, it quantifies how much of the asset has changed hands between traders within a given timeframe.
For many traders, trading volume holds a crucial position as an indicator. There exists a common adage in the trading realm: "Volume precedes price," suggesting that fluctuations in volume can forecast future price movements. A substantial trading volume is often seen as a potential signal for significant price changes, regardless of their direction.
Moreover, trading volume serves as a gauge for assessing the strength of the prevailing market trend. High volume, accompanying periods of heightened volatility, typically validates the existing price trend. In cases where volatility is on the rise but trading volume remains low, it can indicate fragility within the current trend.
Price levels where substantial trading volume has occurred in the past can serve as attractive entry or exit points for traders. Since historical patterns often repeat themselves, increased activity at these levels can generate trading opportunities. Support and resistance levels paired with increasing trading volume are frequently regarded as more dependable signals.
What is the Relative Strength Index (RSI)?
The Relative Strength Index (RSI) is a tool that helps traders determine whether an asset is in an overbought or oversold condition. This oscillator, which measures the speed of price changes, is represented as a numerical value ranging from 0 to 100 and is typically displayed as a line on a chart.
The underlying idea behind the RSI is to gauge market momentum. If prices are rising with increasing momentum, it may indicate a strong uptrend. Conversely, if price increases are accompanied by diminishing momentum, it could signal weakness in the current trend and the potential for a reversal.
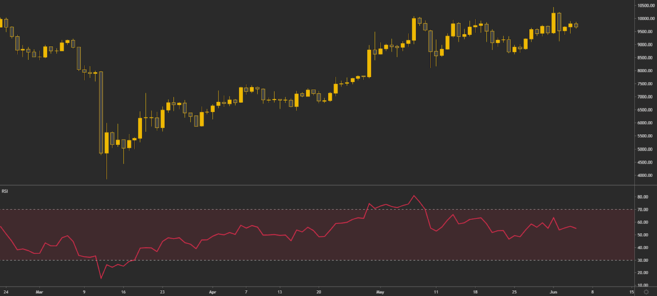 RSI indicator on the Bitcoin chart.
Traditionally, the RSI is interpreted as follows: when the RSI value drops below 30, it may suggest that the asset is oversold, and a period of upward correction may be imminent. If the RSI rises above 70, it may indicate that the asset is overbought, and a downward correction may be in store.
However, it's important to remember that RSI readings should be approached with some caution, as they can occasionally reach extreme values in unusual market conditions, and the current trend may persist despite this.
What is a Moving Average (MA)?
A Moving Average (MA) is a popular tool in technical analysis that helps smooth out the price dynamics of an asset and identify overall market trends. The primary principle behind the moving average is to calculate the average of past price data, making it a lagging indicator that does not predict future price movements.
There are two main types of moving averages: the Simple Moving Average (SMA) and the Exponential Moving Average (EMA). The Simple Moving Average is calculated by finding the arithmetic average of prices over a specified number of past periods. For example, a 10-day SMA would calculate the average price over the last 10 days and display it on a chart.
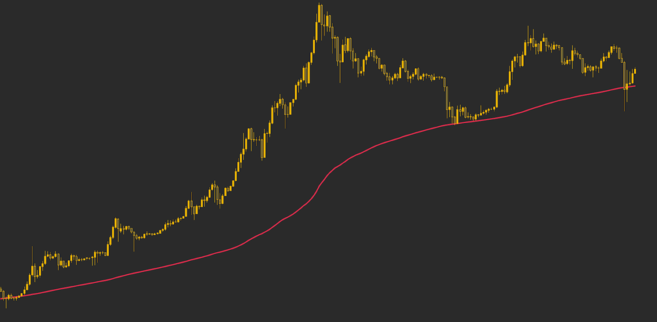 200 week moving average for Bitcoin price.
The Exponential Moving Average, or EMA, gives more weight to recent price data, making it more responsive to recent price changes compared to the SMA, which takes more time to react to new movements.
It's important to note that moving averages have a lag in their signals, and the longer the period they are based on, the greater this lag. For example, a 200-day moving average will react more slowly to price changes than a 100-day moving average.
What is the Moving Average Convergence Divergence (MACD) Indicator?
The Moving Average Convergence Divergence (MACD) indicator is a tool used by traders to gauge the momentum of a market. It relies on the calculation of two moving averages and is considered a lagging indicator because it incorporates past price movements.
The MACD consists of two primary lines: the MACD line and the signal line. The MACD line is determined by subtracting a 26-period Exponential Moving Average (EMA) from a 12-period EMA. Subsequently, a 9-period EMA is applied to the MACD line to create the signal line. Visually, the MACD can also be represented as a histogram, illustrating the difference between the MACD line and the signal line.
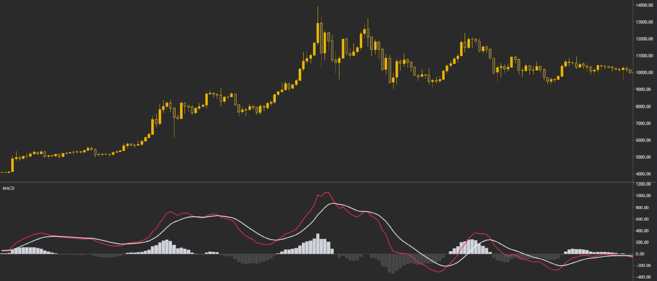 MACD indicator on the Bitcoin chart.
Traders utilize the MACD to analyze the interaction between the MACD line and the signal line. The critical point occurs when these lines cross paths. If the MACD line crosses below the signal line, it can be interpreted as a bearish signal, indicating potential price declines. Conversely, if the MACD line crosses above the signal line, it can be viewed as a bullish signal, suggesting potential price increases.
What are Fibonacci retracement levels?
Fibonacci retracement levels, also known as "Fibonacci retracements" or "Fibonacci recovery levels," are a widely used tool in technical analysis that relies on a numerical sequence known as the Fibonacci sequence. This numerical sequence was initially formulated by the Italian mathematician Leonardo Fibonacci in the 13th century.
The Fibonacci numbers serve as the foundation for various technical analyses, and the Fibonacci retracement tool utilizes specific percentage ratios derived from this sequence. These percentage levels encompass:
0% 23.6% 38.2% 61.8% 78.6% 100%
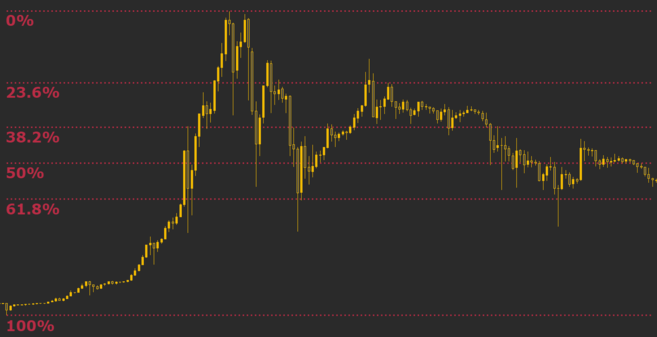 Fibonacci levels on the Bitcoin chart.
Despite the 50% level not being an exact Fibonacci number, it is commonly included in the analysis. Furthermore, traders sometimes incorporate other Fibonacci ratios beyond the primary range, such as 161.8%, 261.8%, and 423.6%.
Traders use Fibonacci retracement levels to identify potential support and resistance levels on a price chart. Typically, they choose two significant price points on the chart, like a low and a high, and utilize the 0% and 100% values to delineate this range. This approach enables traders to pinpoint areas of interest for potential entry and exit points in trades and establish stop-loss levels for risk management.
What is Stochastic RSI (StochRSI)?
Stochastic RSI, or StochRSI, is an indicator derived from the Relative Strength Index (RSI). The primary purpose of StochRSI is also to assess the level of overbought or oversold conditions of an asset, but its values are not calculated based on price data, as with RSI, but rather on RSI values themselves.
StochRSI values typically fall within a range of 0 to 1 (or 0 to 100, depending on charting tool settings). The StochRSI indicator is most informative when it is close to the upper or lower boundary of its range. However, due to its high sensitivity and frequent updates, it can generate many false signals that require careful interpretation.
The interpretation of StochRSI is similar to RSI. When the StochRSI value rises above 0.8, the asset is considered overbought, and when it falls below 0.2, the asset is considered oversold. It is important to note that these values should not be considered as the sole signals for making decisions to enter or exit positions. The information provided by the indicator is valuable, but it is best used in conjunction with other methods and market analysis tools for more reliable signals and decision-making.
What are Bollinger Bands (BB)?
Bollinger Bands, which bear the name of their creator John Bollinger, stand out as distinctive technical tools within the realm of technical analysis. They serve the crucial purpose of gauging market volatility, offering traders a valuable means to identify potential states of overbought or oversold conditions. This distinctive indicator comprises three distinct lines: a central middle band (often a Simple Moving Average or SMA) flanked by upper and lower bands. These bands are thoughtfully plotted onto the price chart. The underlying concept revolves around the idea that the separation between these bands widens or narrows in response to shifting market volatility.
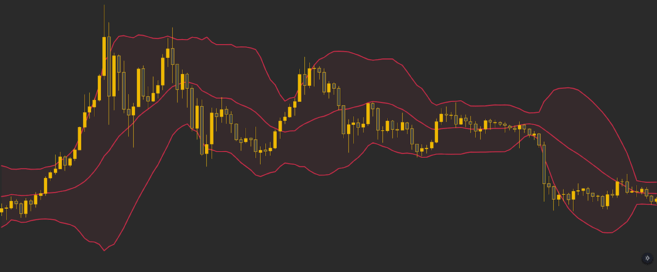 Bollinger Bands on the Bitcoin chart.
The customary interpretation of Bollinger Bands is as follows: when the price gravitates towards the upper band, it implies that the asset may be nearing an overbought state, potentially prompting caution among traders. Conversely, when the price gravitates towards the lower band, it may signal an impending oversold condition, potentially piquing interest among traders looking for potential buying opportunities.
Nonetheless, what makes Bollinger Bands unique is the understanding that prices predominantly reside within the bands, and occasional excursions beyond these boundaries don't automatically trigger immediate buy or sell signals. Rather, these excursions signify exceptional or extreme market conditions, warranting further analysis and consideration.
Furthermore, the exceptional aspect of Bollinger Bands lies in their predictive capability related to a market phenomenon known as a "Bollinger Band squeeze." During such episodes, the market experiences a distinct reduction in volatility, leading to the contraction of the bands as they draw closer together. During this phase, the price remains confined within a relatively tight range. This unique situation creates pent-up pressure within this constrained range, often resulting in a notable market breakout characterized by heightened volatility. It's noteworthy that the direction of this breakout can be either upward or downward, adding to the intriguing aspect of the squeeze strategy. As such, the Bollinger Band squeeze strategy is considered neutral and is most effectively employed in conjunction with other analytical tools, such as support and resistance levels, to enhance its reliability and effectiveness.
What is Volume Weighted Average Price (VWAP)?
The Volume Weighted Average Price, or VWAP, is an indicator that combines trading volume with price data. Essentially, it represents the average price of an asset over a specific time period, with each price weighted by its trading volume. This makes VWAP more informative than a simple average price because it takes into account where the majority of trading activity occurred.
Traders use VWAP to analyze the current market situation. If the market is trading above the VWAP level, it may indicate a bullish trend, while trading below VWAP may suggest a bearish trend. This approach is similar to using moving averages, but VWAP more accurately incorporates trading volume.
Additionally, VWAP helps traders identify levels of increased liquidity in the market. Some traders use a price breakthrough above or below the VWAP level as a signal to enter or exit a position. However, for more reliable results, additional analysis and the use of other indicators are often required to manage risks effectively.
What is a parabolic SAR system?
The Parabolic Stop and Reverse (SAR) system is an indicator employed to ascertain the current market trend's direction and identify potential reversal points. Its acronym, "SAR," signifies "Stop and Reverse," indicating its role in issuing signals for closing the current position and initiating an opposing one.
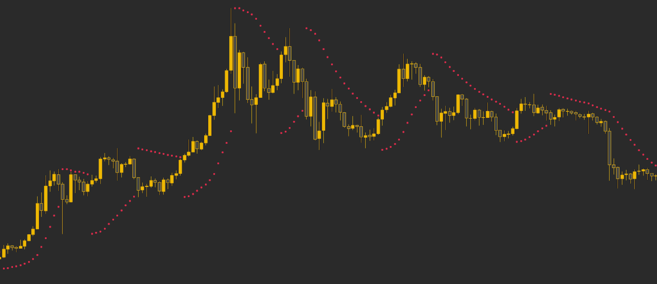 Parabolic SAR indicator on the Bitcoin chart.
Displayed on the chart as a sequence of dots, the Parabolic SAR can be situated either above or below the price movement. When below the price, it signifies an upward trend, while dots above the price indicate a downward trend. Changes in the dot placement occur precisely at trend reversal moments.
The Parabolic SAR assists in determining the market trend's direction and can be utilized to pinpoint instances where the trend might undergo a change. Some traders also utilize this indicator to establish a trailing stop-loss, which automatically adapts to price fluctuations and safeguards accrued profits during robust trends.
It's crucial to recognize that the Parabolic SAR is most effective when the market exhibits clearly defined trends and could yield misleading signals during periods of lateral or range-bound price movements.
What is the Ichimoku cloud?
The Ichimoku Cloud is a sophisticated technical indicator that consolidates multiple other indicators into a unified graphical representation. Despite its initial intricacy, the Ichimoku Cloud furnishes traders with clear and informative signals for making market decisions.
This indicator relies on the calculation of five moving averages, which are subsequently displayed on the chart in the form of a "cloud." This cloud can function as an indicator for gauging the direction of the trend, identifying levels of support and resistance, and assessing the broader momentum of the market.
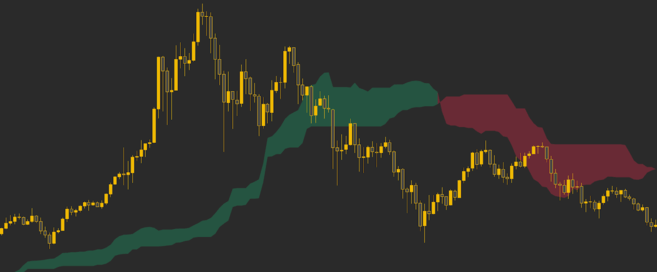 The Ichimoku cloud on the Bitcoin chart acts first as support and then as resistance.
When an asset's price resides above the Ichimoku Cloud, it may imply the presence of an upward trend. Conversely, when the price descends below the cloud, it can be interpreted as a sign of a downward trend.
It's essential to recognize that the Ichimoku Cloud can also complement other trading signals, aiding traders in making more informed market decisions. Despite its initial complexity, many traders find this indicator valuable once they have a comprehensive grasp of its underlying principles.
Cryptocurrency Trading Tips
How to start trading cryptocurrency?
To commence cryptocurrency trading, there are several vital factors to take into account.
First and foremost, it's crucial to understand that trading requires a certain amount of capital. Never risk funds that you cannot afford to lose. Cryptocurrency trading can be intricate and fraught with risks, and the majority of newcomers end up losing their investments. Therefore, begin with an amount you are willing to part with.
Developing a well-thought-out strategy is also essential for successful trading. There are numerous trading approaches for cryptocurrencies, and you must select one that aligns with your financial objectives and available resources.
Furthermore, it's worth noting that many traders prefer not to rely exclusively on trading as their sole source of income. This approach allows them to better manage emotions and stress since trading outcomes do not directly impact their day-to-day lives. If you're a novice, it's advisable to start with education and practice using small sums. Additionally, explore options for generating passive income through cryptocurrency.
What is a trade journal and should you use one?
A trading journal is a vital tool for documenting your trading activities, and its value should not be underestimated. You can choose the format that suits you, whether it's a basic Excel spreadsheet or specialized trading journal software.
Many traders believe that maintaining a trading journal plays a crucial role in achieving consistent profitability, particularly for those actively involved in trading. Why is it so important? It allows you to identify your strengths and weaknesses by carefully recording your trading actions. Without a trading journal, you would lack an unbiased assessment of your trade performance.
Furthermore, a trading journal helps reduce the impact of biases when making trading decisions. How does it accomplish this? It relies on concrete information and data, serving as an impartial observer. If your trading activities deviate from your plans, these discrepancies will be documented in your journal. By consistently maintaining a trading journal, you can closely track which strategies produce the most favorable outcomes.
How to calculate position size in trading?
Calculating position size in trading is one of the key aspects of risk management, and many consider it to be the most critical element in trading. This process allows traders to effectively manage their investments and minimize losses. Here's how it works:
-
Determine Risk: First, you need to determine what percentage of your account you are willing to risk on each trade. Typically, this percentage is around 1-2% of your total capital. For example, if you have $10,000 in your account and decide to risk 1%, it means you are willing to lose no more than $100 on a single trade.
-
Set a Stop-Loss: Next, define the stop-loss level for each trade. A stop-loss is a price level at which you will exit the trade to minimize losses. The size of the stop-loss can vary depending on your trading strategy and market conditions.
-
Calculate Position Size: To calculate the position size, you can use the following formula: (Risk Amount / Stop-Loss Size) = Position Size. For example, if you are willing to risk $100 (1% of your account) and you set a stop-loss at 20 pips, your position size would be $100 / 20 = $5.
Therefore, the position size is calculated to ensure that if the stop-loss is triggered, the losses will be within the predetermined percentage of your account. This approach allows traders to effectively manage risks and avoid overly large losses, which is especially important in trading.
Should you join paid trading groups?
Joining paid trading groups is not necessarily a mandatory step. Today, there are plenty of free resources and sources where you can gain extensive knowledge about trading. Why pay when you can learn for free? Self-practice and learning from your own mistakes also play an important role in the learning process and help you develop your own trading style.
Joining paid groups can be beneficial, but it's important to be cautious and vigilant. Scams and false advertising are not uncommon, and trading results can be easily manipulated to attract new subscribers.
It's also essential to ask yourself why a successful trader would choose to offer their services for a fee. If they are genuinely successful, why would they need additional money? Some successful traders may create paid communities with additional benefits, but it's always advisable to evaluate such offers critically and carefully.
Of course, there are examples of paid groups that provide valuable knowledge and additional resources, but it's always better to approach such offers cautiously and thoughtfully, especially if you are a beginner trader.
What is pump and dump?
The "pump and dump" scheme is a market manipulation tactic where the price of an asset is artificially inflated through the spread of false or manipulative information. When the price reaches significant highs (pump), participants in this scheme begin selling the asset en masse (dump) at a high price, making a profit, while inexperienced investors buy the asset at an inflated price and later incur losses.
This scheme is most commonly seen in the cryptocurrency market, especially during bull markets when there is significant interest from new investors. Typically, organizers of the scheme gather in "pump and dump groups," offering participants the promise of quick profits in exchange for certain services or fees. However, in reality, participants in the scheme profit the most, while other investors are exposed to the risk of losses.
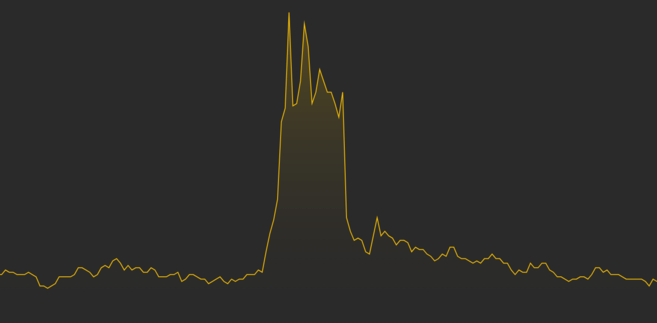 Typical price movement according to a pump and dump pattern.
These fraudulent schemes can be devastating, especially for those who lack experience in investing. In some countries, organizers of such schemes may face legal repercussions and penalties in traditional markets.
Is it worth participating in cryptocurrency airdrops?
Participating in cryptocurrency airdrops can be considered, but with caution and prudence. Airdrops are a method of distributing cryptocurrency to a wide audience, and they can have both positive and negative aspects.
On the one hand, airdrops can be a way to receive a small amount of cryptocurrency for free, which, if successful, can bring some profit. It can also support network decentralization and increase the number of independent hodlers, which is important for a healthy cryptocurrency ecosystem.
On the other hand, scammers can also use airdrops to collect personal information or deceive users. They may request access to your personal data, posing a threat to your privacy and security.
Therefore, before participating in cryptocurrency airdrops, it is important to carefully assess the risks and the source of information about the specific airdrop. Often, it is wiser to seek more reliable and verified ways to engage with the cryptocurrency community and invest in digital assets.
Summary
Cryptocurrency trading is a complex endeavor that requires traders to understand a multitude of key concepts. This guide has provided you with extensive information and hopefully helped you better grasp the aspects of cryptocurrency trading. Remember that successful trading requires not only knowledge but also practice, discipline, and risk management skills. With diligence and the right approach, you can achieve success in this exciting realm of finance. Best of luck in your trading endeavors!