A Beginner's Guide to Basic Chart Patterns
Classic graphic patterns
Classical chart patterns represent recurring formations on candlestick charts, reflecting changes in asset prices over time. Technical analysis of financial markets encompasses various approaches, from using indicators and oscillators to analyzing price movements alone.
Candlestick charts depict the price dynamics of assets, where patterns can be identified in their historical movements. These patterns hold valuable information about an asset's dynamics, and traders often rely on them across various markets like forex, stocks, and cryptocurrencies.
The most common among these patterns are consolidated into classical chart patterns. They stand as some of the most well-known and reliable trading indicators for many traders. Despite trading and investing typically being associated with seeking unique signals that others might overlook, the effectiveness of classical patterns also hinges on market participants' psychology. Since technical models aren't based on scientific principles or physical laws, their efficiency largely relies on the number of participants utilizing these patterns.
Flags
Flags are consolidation zones that emerge in contrast to a long-term trend, forming after sharp price movements. In shape, they resemble a flag attached to a flagpole, where the flagpole represents a sharp price spike, and the flag signifies a period of stabilization.
The use of flags involves identifying potential continuations of the current trend. However, the trading volume accompanying the formation of this pattern is also crucial. Ideally, the impulse movement is accompanied by high volume, while the consolidation phase is characterized by a decrease in trading volume.
Bullish flag
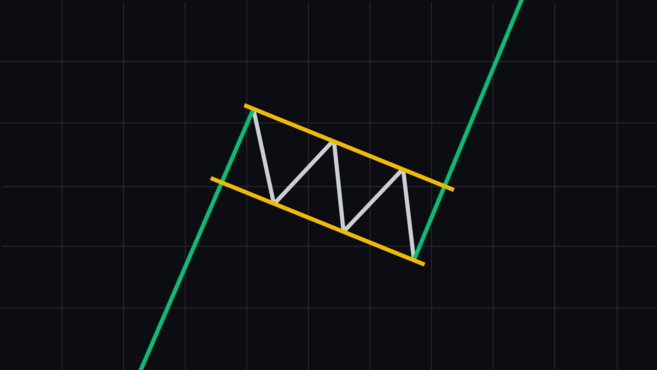
A bullish flag forms during an uptrend and follows a sharp price surge. Typically, after the formation of a bullish flag, the uptrend is maintained and continues.
Bearish flag
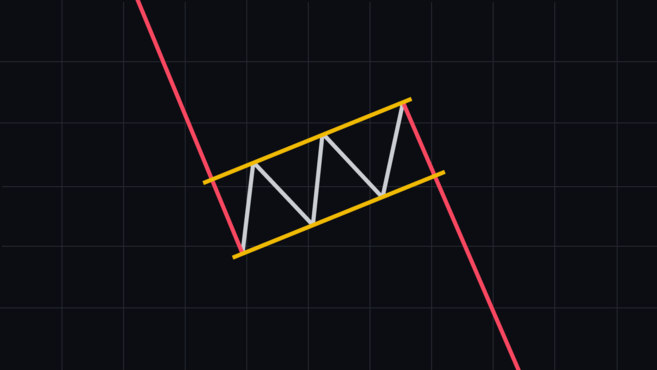
A bearish flag forms during a downtrend and follows a sharp decline in prices. Typically, after the formation of a bearish flag, the downtrend is sustained and continues.
Pennants
Pennants are variations of flags, where the consolidation zone is bounded by converging trend lines, resembling something like a triangle. A pennant is a neutral pattern; its interpretation largely depends on the context of the pattern formation.
Triangles
Triangles are a graphical pattern where the price range narrows, typically followed by a continuation of the current trend. It reflects a temporary slowdown in the main trend but can also foreshadow a change in direction or the continuation of movement.
Ascending triangle
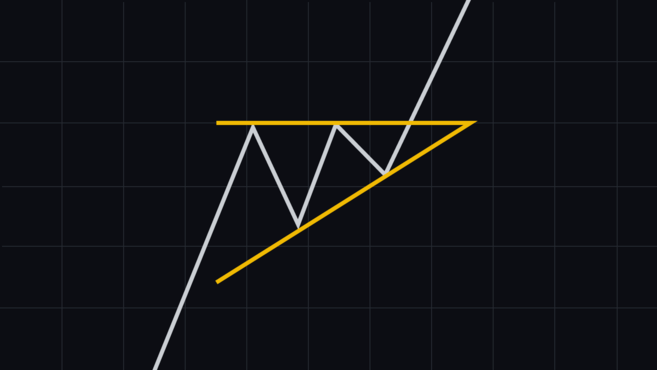
An ascending triangle forms by intersecting a horizontal resistance line with an upward trend line drawn through a series of ascending lows. This indicates that with each bounce of the price off the horizontal resistance level, buyers enter the market at higher prices, forming higher lows. Accumulation of pressure occurs within the resistance zone, and breaking through this level usually results in a rapid price increase with significant trading volume. Hence, the ascending triangle represents a bullish pattern, signaling a potential continuation of the upward trend.
Descending triangle
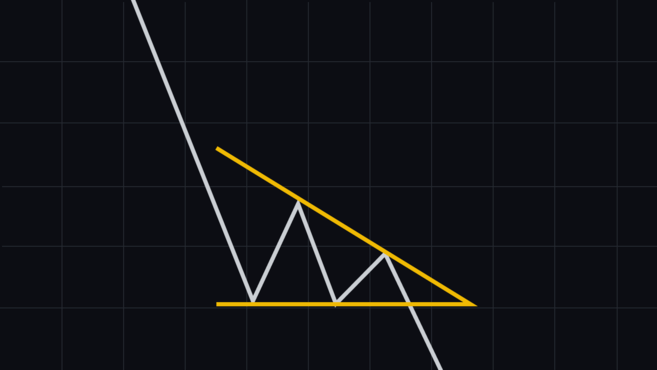
A descending triangle represents the inverse version of an ascending triangle. It forms when there's a horizontal support area and a descending trend line drawn through a series of decreasing highs. Similar to the ascending triangle, every time the price rebounds from the horizontal support level, sellers enter the market at lower prices, creating lower highs. A breakout of the horizontal support area is often accompanied by a sharp price decline with high trading volume. Hence, it is a bearish pattern indicating a potential continuation of the downward trend.
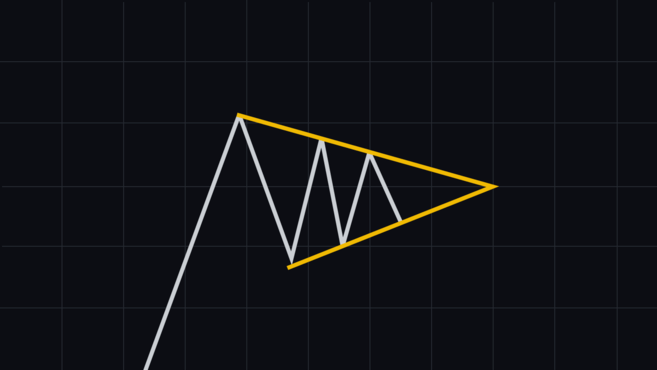
Symmetrical triangle
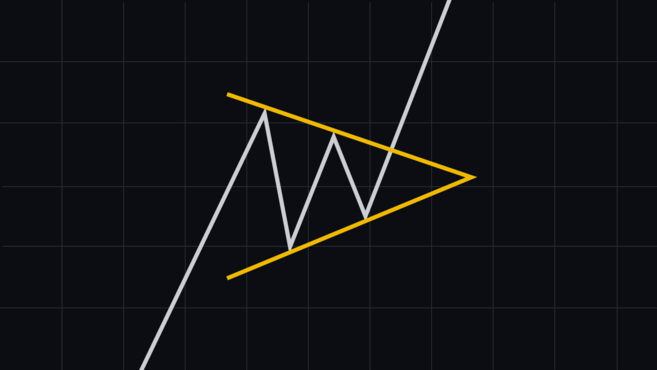
A symmetrical triangle forms when there's a descending upper trendline and an ascending lower trendline, both having approximately the same slope. It's not recognized as either a bullish or bearish pattern because its interpretation heavily relies on the context, especially the prevailing trend. This pattern is considered neutral, indicating a period of temporary market consolidation.
Wedges
A wedge forms as trend lines narrow, indicating a decrease in the price range. In this pattern, trend lines suggest that highs and lows are moving upwards or downwards at different rates.
This could indicate a potential reversal as the main trend begins to weaken. The wedge pattern is often accompanied by declining trading volume, which also signals a loss of momentum in the current trend.
Ascending wedge
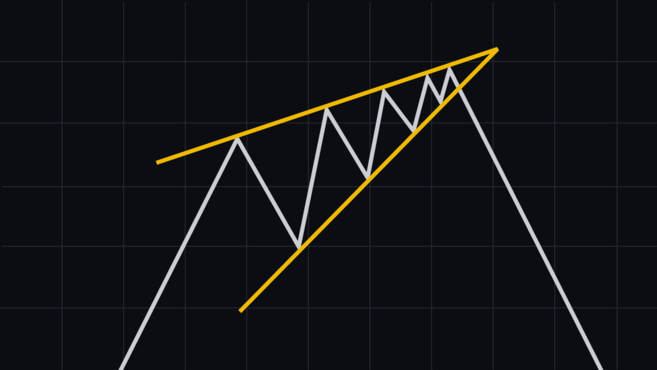
An ascending wedge is a pattern indicating a potential bearish reversal. As prices narrow within the ascending wedge, the upward trend starts to lose its strength, potentially leading to a breakout below the lower trend line. This pattern often signals a possible change in price direction in the market.
Descending wedge
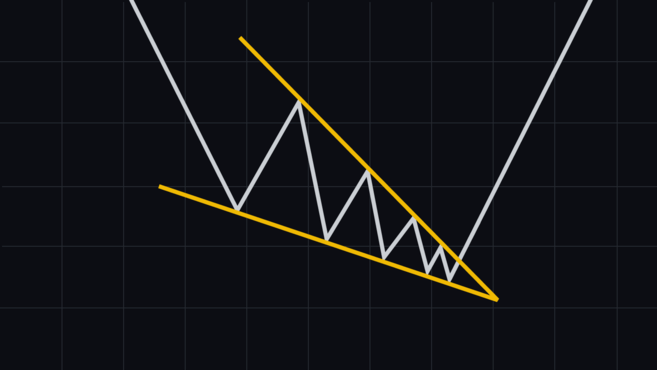
A descending wedge is a pattern that suggests a potential bullish reversal. As prices narrow within the descending wedge and market activity decreases, tension builds up. Often, this pattern is followed by a breakout to the upside with an impulsive movement in prices, indicating a potential change in the trend direction towards bullishness.
Double top and double bottom
An ascending wedge is a pattern indicating a potential bearish reversal. As prices narrow within the ascending wedge, the upward trend starts to lose its strength, potentially leading to a breakout below the lower trend line. This pattern often signals a possible change in price direction in the market.
Double top
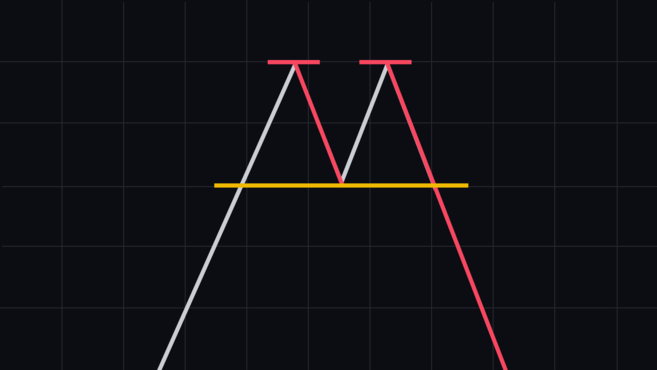
The double top pattern often signals a potential bearish reversal. It is characterized by the price reaching two peaks and failing to break higher after the second attempt. The decline between the two peaks is usually modest. Confirmation of this pattern occurs when the price, after forming the second peak, breaks through the local minimum located between the two peaks.
Double bottom
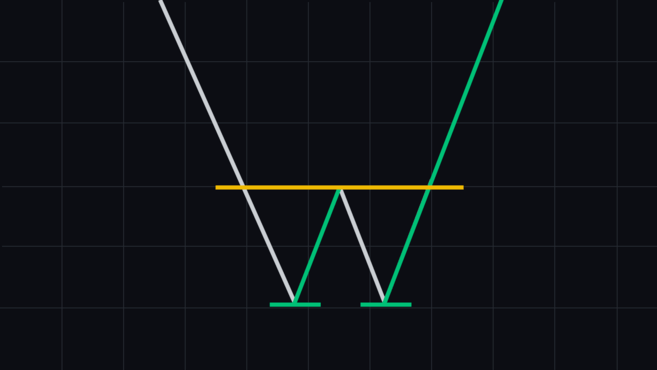
The double bottom represents a bullish reversal pattern in the market. In this scenario, the price reaches two bottoms, followed by a significant increase. Similar to the double top, the difference between the two bottoms is usually moderate. Confirmation of this pattern occurs when the price, after forming the second bottom, surpasses the local maximum located between the two bottoms.
Inverse head and shoulders
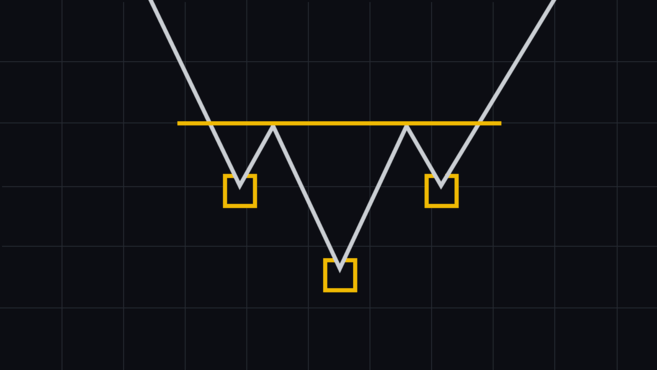
The "inverse head and shoulders" pattern represents a potential shift in the market towards a bullish trend, contrasting the "head and shoulders" pattern. It takes shape when the price reaches a lower low during a downtrend and rebounds toward a support level approximately aligned with the initial low. Confirmation of this pattern happens as the price breaks past the resistance of the neckline (drawn between the peaks separating the inverse "head" and "shoulders") and progresses upward.
Conclusion
Classical chart patterns stand as one of the most renowned tools in technical analysis. However, it's crucial to remember that solely relying on them might be insufficient. The effectiveness of patterns can vary based on market conditions. Therefore, confirming them using other indicators and tools, along with proper risk management, is essential for making more reliable trading decisions.